U.S. Workforce through 2020
Presentation Transcript
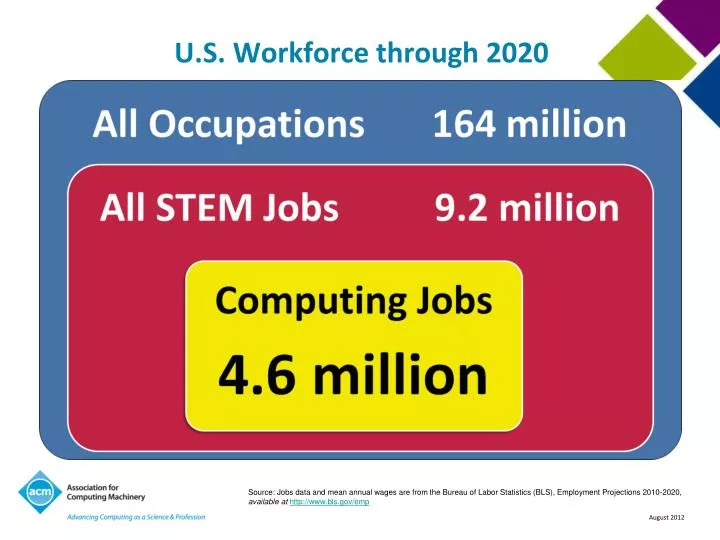
U.S. Workforce through 2020 Source: Jobs data and mean annual wages are from the Bureau of Labor Statistics (BLS), Employment Projections 2010-2020, available athttp://www.bls.gov/emp
Quick Facts about Computing Jobs Though 2020 Computing and mathematicsis one of the TOP 10 fastest growingmajor occupational groups 2010-2020. 150,000+job openings in computing annually. 1 in every 2 STEM jobs will be in computing in 2020. Sources: Jobs data are calculated from the Bureau of Labor Statistics (BLS), Employment Projections 2010-2020, available at http://www.bls.gov/emp/. Educational levels are calculated from BLS Occupational Projections Data, Employment 2010-2020, available at http://data.bls.gov/oep/ and the BLS Occupational Outlook Handbook 2010-2020, available at http://bls.gov/ooh/.
U.S. Employment through 2020How Computing Stacks Up To Healthcare Growth Rates 22% job growth rate in computing jobs, as comparable to healthcare job growth rates 2010-2020. 51,000projected shortfall in qualified health IT workers 2011-2015. 90% of physicians to use electronic health records by 2019 as a result of the federal HITECH Act of 2009. * Healthcare practitioners and technicians Sources: Bureau of Labor Statistics (BLS), Employment Projections 2010-2020, available at http://www.bls.gov/emp/. U.S. Department of Health and Human Services (HHS), HITECH Programs, http://www.healthit.gov. Congressional Budget Office, Analysis of HITECH Act of 2009.
Where the STEM Jobs Will BeProjected Annual Growth of Total STEM Job Openings 2010-2020 • * STEM is defined here to include non-medical occupations. • Source: Jobs data are calculated from the Bureau of Labor Statistics (BLS), Employment Projections 2010-2020, available at http://www.bls.gov/emp/.
Where the STEM Jobs Will BeProjected Annual Growth of NEWLY CREATED STEM Job Openings 2010-2020 • * STEM is defined here to include non-medical occupations. • Source: Jobs data are calculated from the Bureau of Labor Statistics (BLS), Employment Projections 2010-2020, available at http://www.bls.gov/emp/.
Where the STEM Jobs Will BeDegrees vs. Jobs Annually Sources: Degree data are calculated from the National Science Foundation (NSF), Science and Engineering Indicators 2012, available at http://www.nsf.gov/statistics/seind12/appendix.htm. Annual jobs data are calculated from the Bureau of Labor Statistics (BLS), Employment Projections 2010-2020, available at http://www.bls.gov/emp/. STEM is defined here to include non-medical degrees and occupations.
Where the STEM Jobs Will BeTop 10 STEM Occupations by Total Employment in 2020 Source: Jobs data are calculated from the Bureau of Labor Statistics (BLS), Employment Projections 2010-2020, available at http://www.bls.gov/emp/. STEM is defined here to include non-medical occupations.
Where the U.S. Jobs Will BeTop 10 Major Occupational Groups 2010-2020 and Average Salaries in May 2011 Sources: Jobs data are from the Bureau of Labor Statistics (BLS), Employment Projections 2010-2020, available at http://www.bls.gov/emp/. Salary data are from BLS Occupational Employment Statistics, May 2011, available at http://www.bls.gov/oes/current/oes_nat.htm.
Where the STEM Jobs Will BeProjected Growth of Selected STEM Jobs 2010-2020 Sources: Jobs data are from the Bureau of Labor Statistics (BLS), Employment Projections 2010-2020, available at http://www.bls.gov/emp/. Salary data are from BLS Occupational Employment Statistics, May 2011, available at http://www.bls.gov/oes/current/oes_nat.htm. STEM is defined here to include non-medical occupations.
Higher Education Pipeline in Computing Source: National Science Foundation, Science and Engineering Indicators 2012 and various years, available at http://www.nsf.gov/statistics/seind12/. Data are not available from 1999.
Higher Education Pipeline in ComputingCRA Taulbee Survey Results Source: Computing Research Association, Taulbee Survey 2010-2011, available at http://www.cra.org/resources/taulbee/(providing voluntary responses from Ph.D.-granting universities on new enrollments and degrees awarded in their undergraduate CS/CE programs.
High School Advanced PlacementExams 2011 Computer Science Source: College Board, Advanced Placement (AP) Exam Data 2011, available at http://professionals.collegeboard.com/data-reports-research/ap/data. Calculus represents the combined data of Calculus AB and BC. Physics represents the combined data of Physics B, C:Electricity and Magnetism, and C:Mechanics. Computer Science represents combined data of Computer Science A and B.
High School Advanced PlacementExams 1997-2011 Source: College Board, Advanced Placement (AP) Exam Data 2011, available at http://professionals.collegeboard.com/data-reports-research/ap/data. Calculus represents the combined data of Calculus AB and BC. Physics represents the combined data of Physics B, C:Electricity and Magnetism, and C:Mechanics. Computer Science represents combined data of Computer Science A and B.
High School Advanced Placement Exams 2011 Female Male Computer Science Source: College Board, Advanced Placement (AP) Exam Data 2011, available at http://professionals.collegeboard.com/data-reports-research/ap/data. Calculus represents the combined data of Calculus AB and BC. Physics represents the combined data of Physics B, C:Electricity and Magnetism, and C:Mechanics. Computer Science represents combined data of Computer Science A and B.
How Computer Science “Counts” In K-12 Source: Association for Computing Machinery & Computer Science Teachers Association, Running on Empty: The Failure to Teach K-12 Computer Science in the Digital Age (2010), at page 45, available at http://www.acm.org/Runningonempty.
Diminishing Access to Computer Science Courses Source: U.S. Department of Education, National Center for Education Statistics, High School Transcript Study, various years, 1990-2009, available at http://nationsreportcard.gov/hsts_2009/.
Exposure to Computer Science Matters • Students that take AP CS are 8 times more likely to major in CS. • In the summer of 2010, Google surveyed a sample of its US employees about exposure to CS prior to college. • Nearly all CS majors (98%) reported being exposed to CS prior to college, compared to less than half of non-CS majors (45%). The nature of the exposure varied from reading about CS, after-school programs or camps, to middle or high school CS classes. • Those who went on to major in CS were more likely than non-majors to have had a CS class offered in their high school. • CS majors were more likely to have known that CS was a possible career path when they were in high school. Source: College Board, Is AP Exam Participation and Performance Related to Choice of College Major? (Research Report 2011-06, 2011), available at http://professionals.collegeboard.com/profdownload/pdf/RR2011-6.pdf. Google, Survey Results of U.S. Employees (2010) (unpublished).
